
Power and demand monitoring
Measures consumption and demand feeder by feeder and line by line, so demand penalties disappear and the electricity bill lands on the cost centre that caused it.
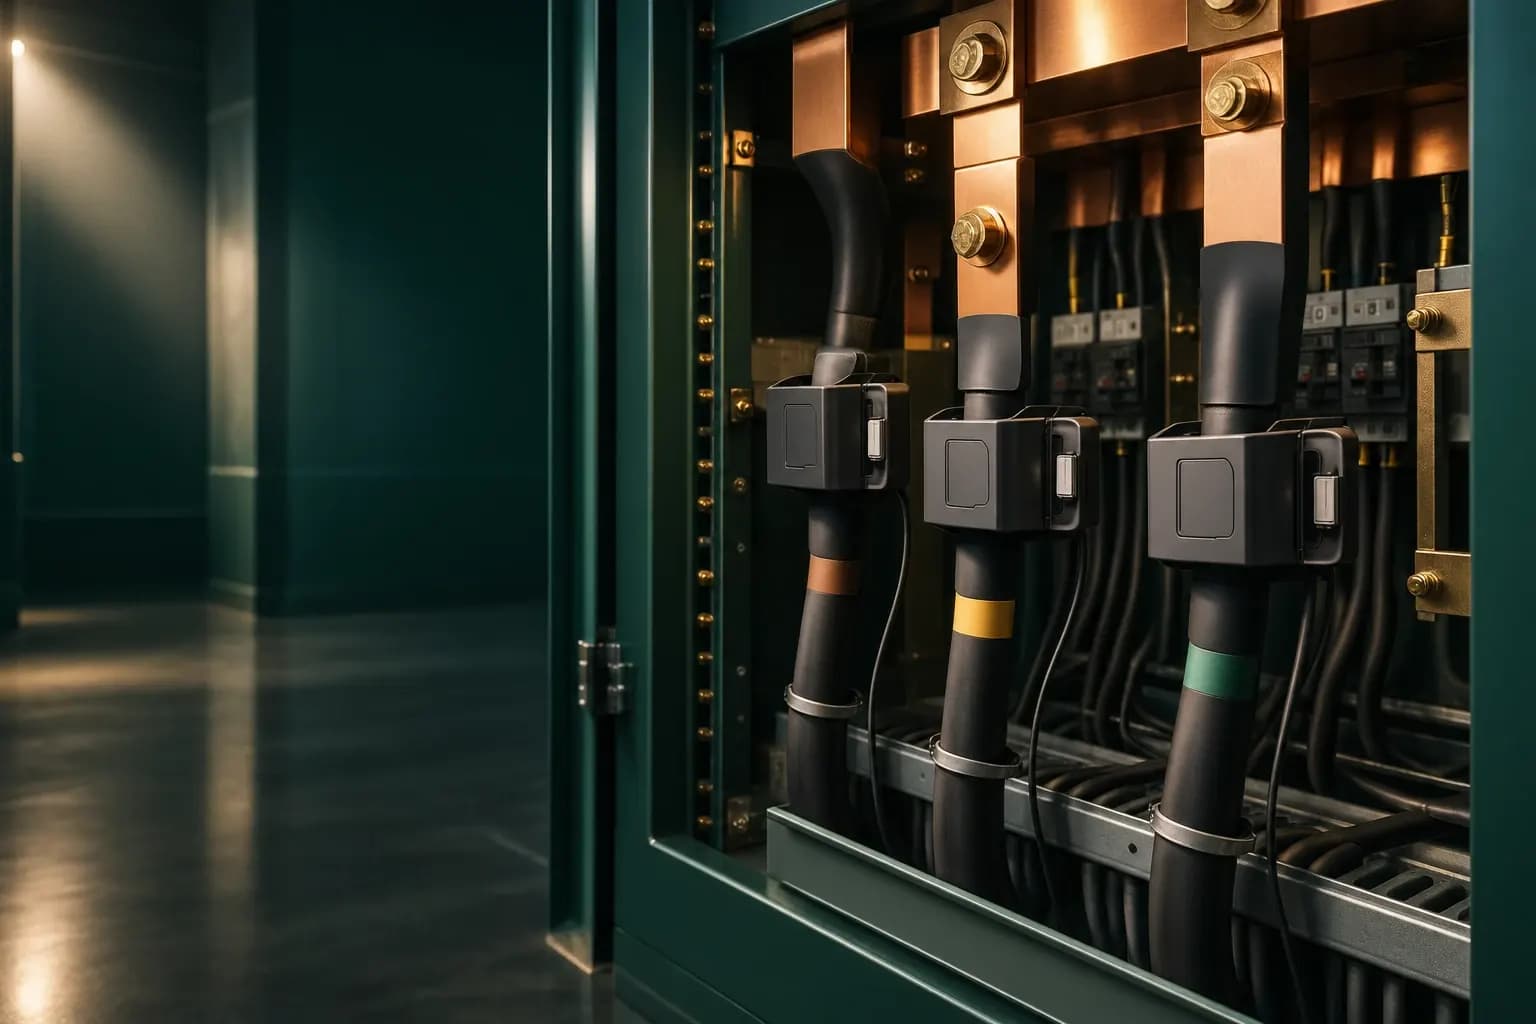
Why this monitoring is needed
An industrial electricity bill is not one number but two: energy and demand. Demand is set by the highest short-interval load, so one accidental simultaneous start of three large motors raises the whole month's bill — sometimes the following months too. Without data that event only shows up on the invoice, a month after it could have been prevented.
The second problem is attribution. When a whole hall feeds from one main board, nobody knows which line owns which share. Metering at feeder level makes the energy cost of each product calculable for the first time.
What gets measured
Per-feeder current
An AC current sensor with a CT clamps onto each feeder and logs that line's load independently of the rest.
Three-phase voltage level
A 50–250 V AC voltage-level sensor exposes voltage sag and phase imbalance — the conditions that burn motors.
Instantaneous peak and the demand window
Continuous sampling exposes the real peak inside the demand-calculation window instead of an hourly average.
Heavy-load run and stop events
Current tells you which machine ran at which hour — equipment left running through an idle shift shows up here.
Power presence on critical circuits
For circuits where you only need to know whether power is present, an AC voltage detector is cheaper and simpler than full metering.
Recommended equipment
Every model below is from the Fidar Electronics range. The final combination is set after a site survey or an engineering consultation.
FCD3245-01
FCD3245-01 Electricity Market Data Logger
Electricity-market data logger for consumption and demand recording
View product ←
FCD6455-01
FIDAQUIRE FCD6455-01 Industrial Data Logger
Modular logger where power monitoring is one part of whole-plant monitoring
View product ←
FBC0232-01
FBC0232-01 CANopen Input Card
CANopen card daisy-chaining the panel sensors
View product ←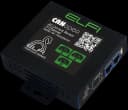
FAC2000-03
3-Channel AC Current Sensor
3-channel AC current sensor covering one feeder's three phases
View product ←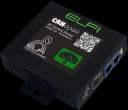
FAC2000-01
AC Current Sensor
Single-channel AC current sensor for individual loads
View product ←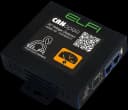
FAV0220-03
AC Voltage Level Sensor
50–250 V AC voltage-level sensor
View product ←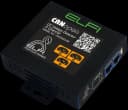
FAV0220-05
3-Channel AC Voltage Detector
3-channel AC voltage detector for critical circuits
View product ←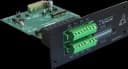
FDR0508-01
FDR0508-01 8-Channel Relay Output Card
8-channel relay card for load management and peak shedding
View product ←Alarm and automation rules
- 1
Instantaneous load approaching the contracted demand ceiling: warn before it is crossed so the operator delays the next start.
- 2
Automatic relay shedding of non-essential loads inside the peak window, by a defined priority list.
- 3
Phase current imbalance beyond the allowed band: alarm — unbalanced load heats motors and ages the transformer.
- 4
Non-zero current on a line that should be off-shift: energy-waste alarm.
- 5
Automatic daily and monthly XLS or CSV reports for the finance team.
What the operator gets
Penalties for exceeding contracted demand are eliminated by pre-emptive warnings.
The energy cost of each production line becomes calculable and attributable.
Off-shift consumption, usually the largest hidden waste, becomes visible and can be removed.
Frequently asked questions
What about high-current feeders? The sensor reads only up to 5 A.
Fit a CT sized for the line. The sensor still reads 0–5 A and the ratio is applied in software, which covers feeders of tens or hundreds of amps without changing the sensor. A split-core CT also lets you install without breaking the circuit.
Does this replace the utility's revenue meter?
No, and it is not meant to. The utility meter is the billing reference; this system is the internal management tool that tells you where that bill came from and which decision reduces it.
Related solutions
Want this solution on your own site?
Send us the site details and we will put together the equipment list and a technical proposal to match.